Yesterday the queue looked normal, until it did not. Ticket volume jumped from the usual 18 per hour to 64, and the categories started clustering almost immediately: VPN, login failures, and device performance.
That moment is familiar to every IT operations team. The first question is rarely "Do we have a problem?" The first real question is "What changed?"
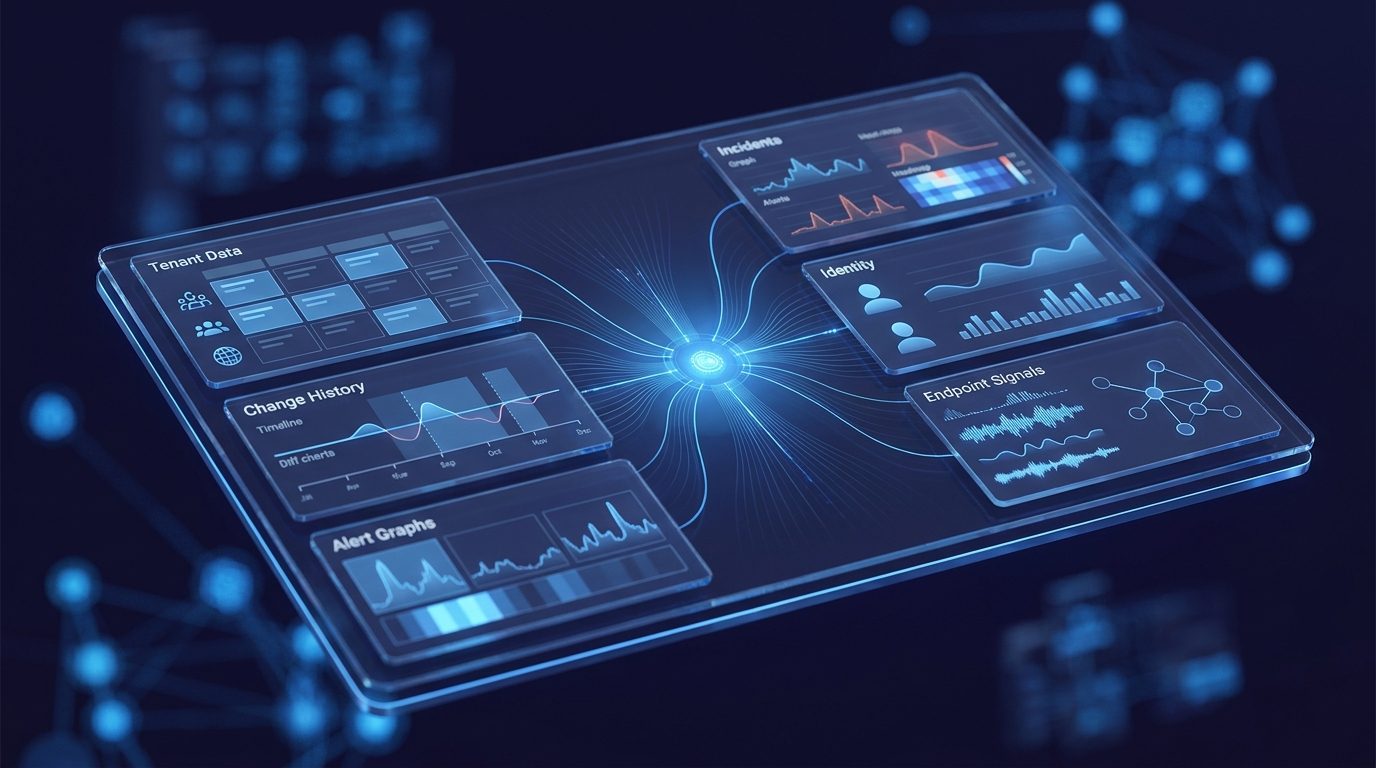
The trouble is that most Microsoft environments cannot answer that question directly. Ticketing systems show symptoms. Intune shows policy movement. Entra ID shows identity events. Audit trails show activity. Endpoint data shows device state. The answer exists across all of them, but it does not arrive as a story.
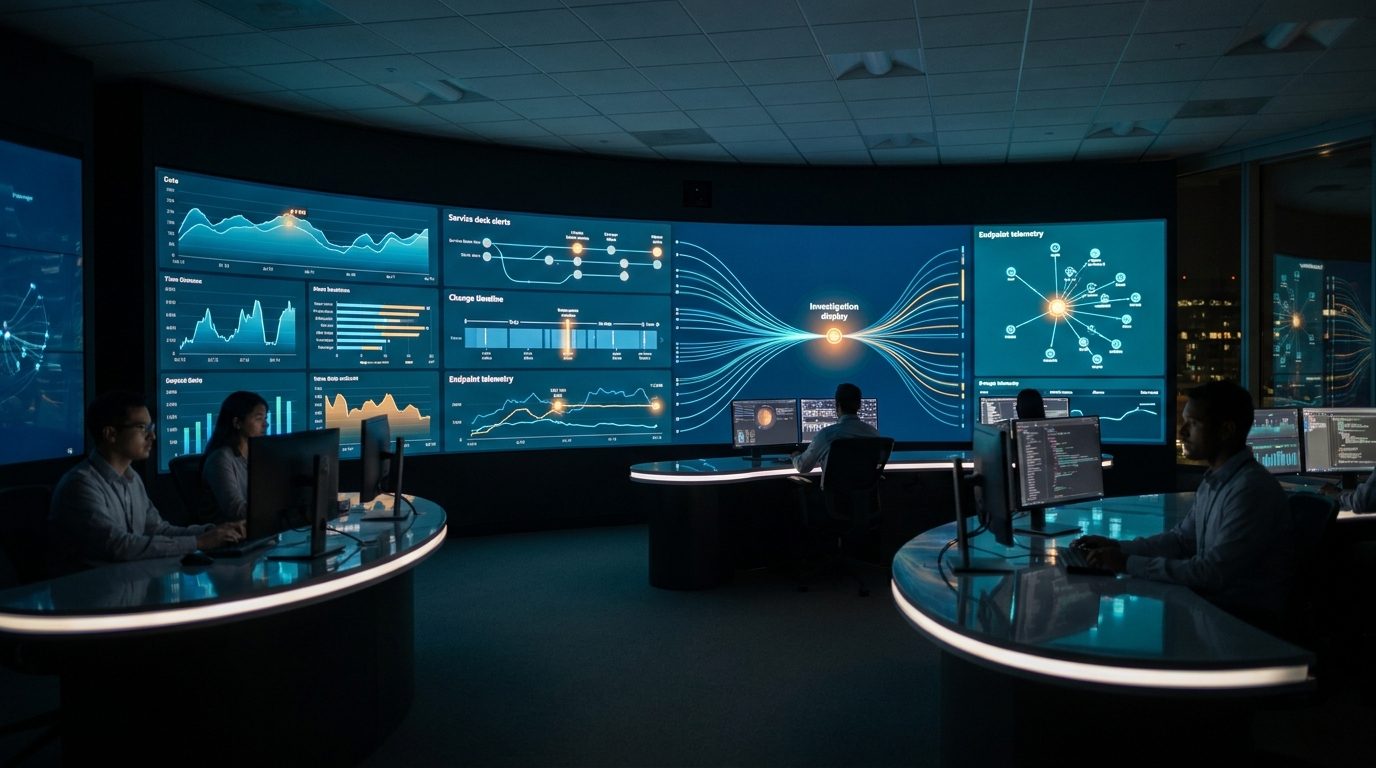
Where a Normal Investigation Loses Time
A conventional investigation starts with portal hopping. Someone opens the service desk queue. Someone else checks KQL. Another engineer looks at Intune changes. Someone pulls Entra events. A senior operator tries to remember whether this pattern feels familiar.
- The ticket queue confirms that users are feeling impact.
- Change systems show activity, but not which changes matter.
- Endpoint and identity telemetry expose symptoms, but not narrative.
- Previous incidents are usually trapped in memory, notes, or scattered runbooks.
By the time the team has a plausible cause, the incident has already become more expensive. That is exactly the gap Panorama AI is designed to close.
How Panorama AI Starts the Investigation
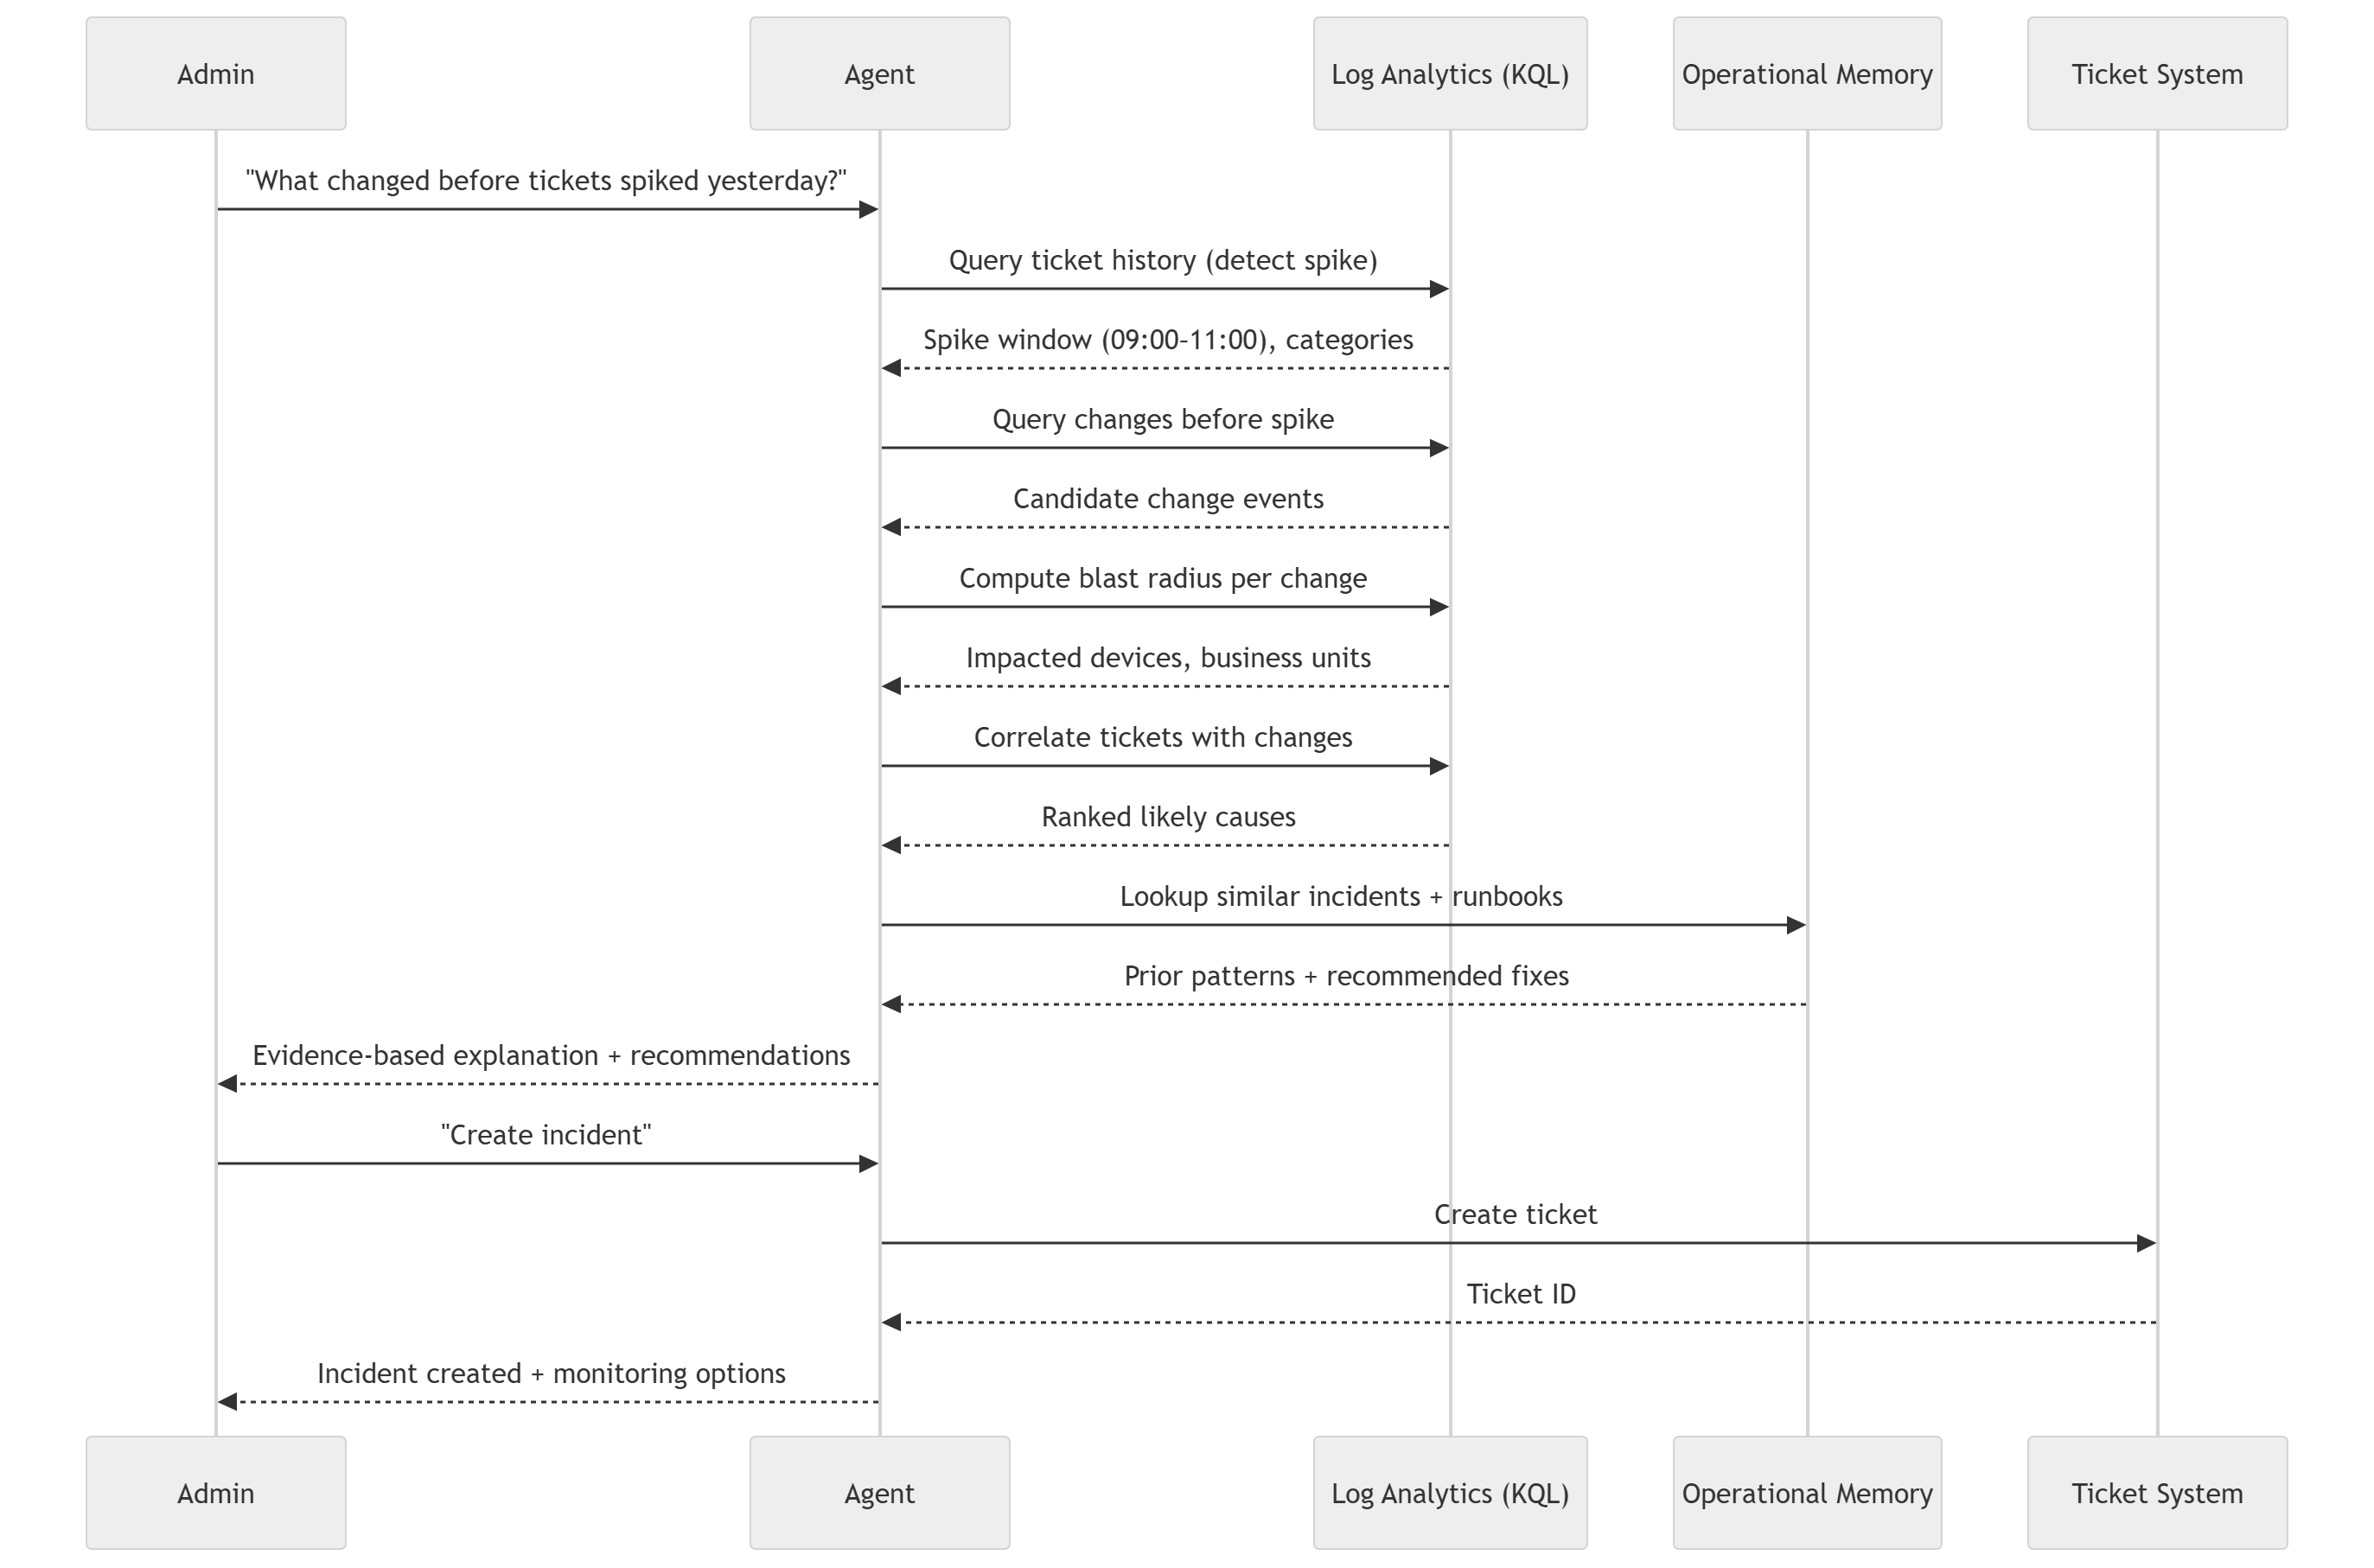
Panorama AI treats the original question as the beginning of an investigation plan, not a prompt for a generic answer. "What changed before tickets spiked yesterday?" becomes a structured sequence: validate the anomaly, define the impact window, reconstruct recent changes, measure blast radius, compare against historical incidents, and produce an evidence-backed recommendation.
First, it proves the spike is real
Panorama AI analyzes ticket history against historical baselines so the team is not reacting to noise. If the normal volume is 18 and the current window is 64, the system confirms the anomaly and surfaces the categories attached to it.
Then, it draws a clean impact window
A good investigation needs a boundary. Panorama identifies when the queue began to diverge, which hours matter most, and which categories belong inside the incident. That gives the rest of the analysis a reliable time frame.
Next, it reconstructs what changed
This is where most teams slow down. Panorama pulls configuration and deployment events across systems and groups them into meaningful candidates instead of a flat list of raw records. That can include Intune policy changes, application rollouts, compliance updates, identity activity, and endpoint state changes.
Why the Architecture Matters
The orchestration model behind Panorama is important because this is not just a chatbot layered over logs. The system coordinates KQL queries, change context tooling, runbook logic, ticketing operations, and operational memory as one investigation surface.
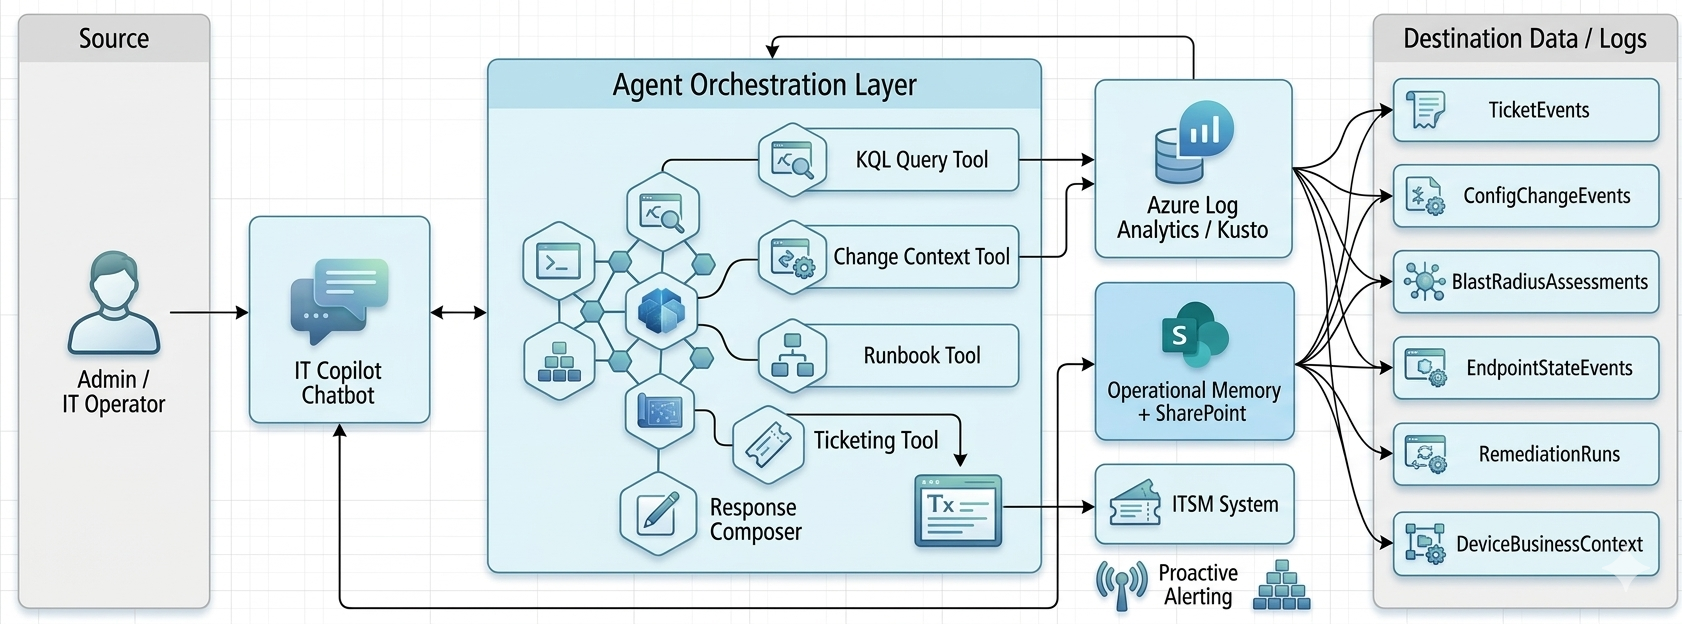
That architecture is what allows Panorama AI to move from "there were many changes yesterday" to "this specific VPN configuration deployed at 07:15 is the highest-confidence cause of the 09:00-11:00 ticket spike."
From Candidate Events to a Likely Root Cause
Once Panorama has a candidate set, it measures blast radius and correlation strength. It checks how many devices were affected, which business units were touched, how much overlap exists between affected devices and ticket submitters, and whether the observed ticket categories align with the state changes.
- Timing alignment between change and spike
- Category match between tickets and the affected system
- Overlap between impacted devices and ticket submitters
- Supporting endpoint or identity state-change evidence
The Step Most Teams are Missing
Operational memory is usually the missing layer. Even when teams solve incidents well, the reasoning often disappears into a ticket comment, a Teams thread, or the head of the engineer who happened to be online that day.
Panorama AI checks whether the current pattern has happened before, what the likely failure mode was, and how it was resolved. That means the investigation is not starting from zero every time the same operational shape appears again.
In practice, that can sound like: this same VPN configuration pattern caused an incident last month, the affected population looked similar, and the successful action was rollback. That is no longer tribal knowledge. It becomes reusable operational intelligence.
Why This Changes the Story for IT
Without an intelligence layer, the story of an incident is written manually and under pressure. With Panorama AI, the story is assembled from evidence. That changes the pace of response and the quality of decisions.
- Before: teams hunt through systems and reconstruct timelines by hand.
- After: teams review a ranked explanation grounded in cross-system evidence.
- Before: similar incidents are rediscovered from scratch.
- After: previous incidents strengthen the current investigation.
Operational Intelligence in Practice
This is why a help desk spike is such a useful test case. It looks simple from the outside, but it forces the environment to answer a hard operational question: not just what happened, but what changed, who was affected, and what the team should do next.
When Panorama AI can answer that question quickly and defensibly, the value is bigger than one incident. The team gains a repeatable way to investigate change, reduce escalation, and preserve operational knowledge over time.
If your team is still manually piecing together incidents, request a technical consultation or explore Panorama AI to see how evidence-backed operational investigations work in practice.